Q.
The graph below illustrates the behaviour of the chromosomes during one mitotic cell division.
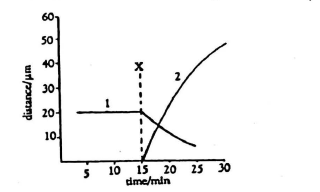
Which one of the following correctly indicates the changes illustrated by curves 1 and 2, and the stage of mitosis
which is commencing at X?.
stage of mitosis commencing at X
distance between centromeres of chromosomes and potes of spindle
distance between centromeres of sister chromatids
(a)
anaphase
1
2
(b)
anaphase
2
1
(c)
Metaphase
1
2
(d)
Metaphase
2
1
| stage of mitosis commencing at X | distance between centromeres of chromosomes and potes of spindle | distance between centromeres of sister chromatids | |
| (a) | anaphase | 1 | 2 |
| (b) | anaphase | 2 | 1 |
| (c) | Metaphase | 1 | 2 |
| (d) | Metaphase | 2 | 1 |
Cell Cycle and Cell Division
Solution: