Tardigrade
Tardigrade - CET NEET JEE Exam App
Exams
Login
Signup
Tardigrade
Question
Biology
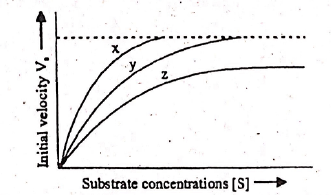
The given figure shows three velocity-substrate concentration curves for an enzyme reaction. What do the curves x, y and z depict respectively? <img class=img-fluid question-image alt=image src=https://cdn.tardigrade.in/img/question/biology/98bb93e2911e8315c4613891cbc858c9-.png />
Question Error Report
Question is incomplete/wrong
Question not belongs to this Chapter
Answer is wrong
Solution is wrong
Answer & Solution is not matching
Spelling mistake
Image missing
Website not working properly
Other (not listed above)
Error description
Thank you for reporting, we will resolve it shortly
Back to Question
Thank you for reporting, we will resolve it shortly
Q. The given figure shows three velocity-substrate concentration curves for an enzyme reaction. What do the curves x, y and z depict respectively?
Biomolecules
A
(x)-normal enzyme reaction, (y)-competitive inhibition, (z) - non-competitive inhibition
60%
B
(x)-enzyme with an allosteric modulator added, (y)-normal enzyme activity, (z)-competitive inhibition
0%
C
(x)-enzyme with an allosteric stimulator, (y)-competitive inhibition added (z)-normal enzyme reaction
0%
D
(x)-normal enzyme reaction, (y)-non-competitive inhibitor added (z)-allosteric inhibitor added
40%
Solution:
Correct answer is (a) (x)-normal enzyme reaction, (y)-competitive inhibition, (z) - non-competitive inhibition