Q.
The figure shows a particle moving along $x$-axis subjected to three periods of acceleration $(a)$. Rank the periods according to the increase they produce in the particle velocity, greatest first.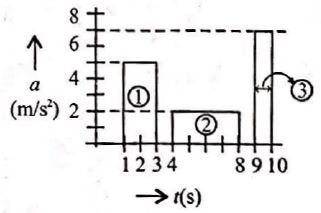
Motion in a Straight Line
Solution:
Area of acceleration-time graph gives velocity. Area of region $(1)$ gives velocity of particles $m\, s^{-1}$
$v_{1}=2\,s\times5 \frac{m}{s^{2}}=10\,m\,s^{-1}$
Similarly, $v_{2}=4\,s \times 2\, \frac{m}{s^{2}}=8\,m/s$
and $v_{3}=1\,s \times 7\, \frac{m}{s^{2}}=7\,m/s$
$\therefore v_{1} > v_{2} > v_{3}$ or