Q.
The distribution of molecular kinetic energy at two temperature is shown in the following graph
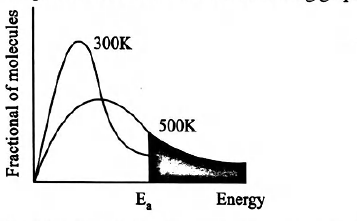
Which of the following conclusions are correct?
Chemical Kinetics
Solution: