Question Error Report

Thank you for reporting, we will resolve it shortly

Back to Question

Q. The current voltage graph for a given metallic wire at two different
temperatures $ {{T}_{1}} $ and $ {{T}_{2}} $ are shown in given figure, which of the relation is correct form the following?Physics Question Image

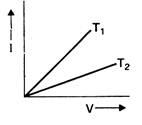
BVP MedicalBVP Medical 2003

Solution:

The slope of given I-V curve $ \frac{1}{V}=\frac{1}{R} $ i.e., slope $ \frac{1}{R} $ The slope of graph at temperature $ {{T}_{1}} $ is greater than that at temperature $ {{T}_{2}} $ so $ {{R}_{1}}<{{R}_{2}} $ Since resistance increases with rise of temperature hence, $ {{T}_{2}}>{{T}_{1}} $