Q. The correct graph showing the relation between energy (E) of photoelectrons and frequency $v$ of incident light is
NEETNEET 2022
Solution:
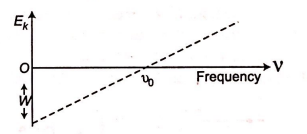
If using light of different frequencies a graph is plotted between the maximum kinetic energy $E_k$ of the photoelectron and frequency $v$ of light, then a straight line is obtained, according to relation $E_k=h v_0-W$, where $W$ is the intercept cut by straight line on negative $E_k$-axis.