Q. The correct graph representing the relation between energy (E) of photoelectrons and frequency (v) of incident light is
VMMC MedicalVMMC Medical 2007
Solution:
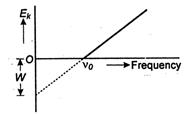
Key Idea: Photoelectric equation has same form as equation of straight line. If using light of different frequencies a graph is plotted between the maximum kinetic energy $ {{E}_{k}} $ of the photoelectrons and frequency (v) of light, then a straight line is obtained, according to relation $ {{E}_{k}}=h{{v}_{0}}-W, $ where W is the intercept cut by straight line on negative $ {{E}_{k}}- $ axis.
Note: If the straight line is extended backwords, it intersects the frequency axis at a point $ {{v}_{0}} $ and intercepts the energy axis at - w. This means that for the photoelectrons to be emitted from a given metal plate the frequency of incident light should be higher than $ {{v}_{0}}, $ otherwise no photoelectrons are emitted.