Question Error Report

Thank you for reporting, we will resolve it shortly

Back to Question

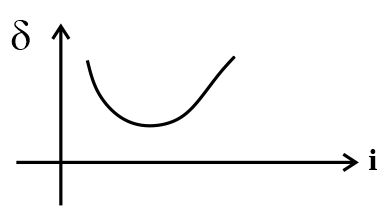
Q. The correct graph between angle of deviation $\left(\delta\right)$ and angle of the incident $\left(i\right)$ for a triangular prism is best represented by

NTA AbhyasNTA Abhyas 2020Ray Optics and Optical Instruments

Solution:

We know that the angle of deviation depends upon the angle of incidence. If we determine experimentally, the angles of deviation corresponding to different angles of incidence and then plot $i$ (on $x$ -axis) and $\delta$ (on $y$ -axis) we get a curve as shown in the figure.

Solution
Clearly, if the angle of incidence is gradually increased from a small value, the angle of deviation first decreases, becomes minimum for a particular angle of incidence and then begins to increase.