Question Error Report

Thank you for reporting, we will resolve it shortly

Back to Question

Q. Study the following graphs and choose the correct option
image
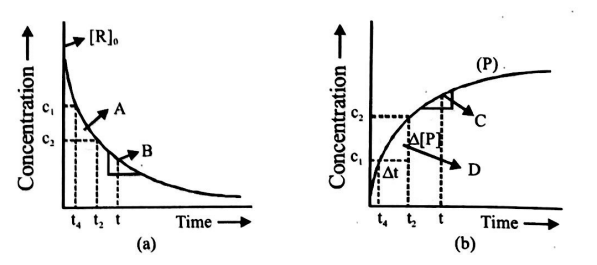
(i) in fig.$ a, A$ represents average rate and $B$ represents instantaneous rate
(ii) in fig. $b, D$ represents average rate and $C$ represents instantaneous rate
(iii) fig. $a, A$ represents instantaneous rate and $B$ represents average rate
(iv) fig. $b, C$ represents average rate and $D$ represents instantaneous rate

Chemical Kinetics

Solution:

Average rate depends upon the change in concentration of reactants or products and the time taken for that change to occur. Average rate cannot be used to predict the rate of a reaction at a particular instant as it would be constant for the time interval for which it is calculated. So, to express the rate at a particular moment of time, we determine the instantaneous rate. It is obtained when we consider the average rate at the smallest time interval say $d t$ (i.e. when it approaches zero).