Question Error Report

Thank you for reporting, we will resolve it shortly

Back to Question

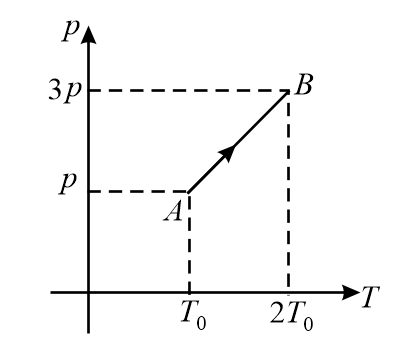
Q. Pressure versus temperature graph of an ideal gas is shown, The density of gas at point $A$ is $\rho _{0}$ then the density of gas at point $B$ would be
Question

NTA AbhyasNTA Abhyas 2022

Solution:

If mass of a gas is constant then there is variation in density of gas with the variation of temperature and pressure because the molar volume of the gas goes on changing because $\rho =\frac{M}{V}$
We know, from Ideal gas law $p=\frac{ρRT}{M}$
For point $A$ , $p=\frac{\rho _{0} RT_{0}}{M}$ $\Rightarrow M=\frac{\rho _{0} RT_{0}}{p}$ ...(i)
For point $B$ , $3p=\frac{ρR \left(\right. 2 T_{0} \left.\right)}{M}=\frac{ρR \left(\right. 2 T_{0} \left.\right)}{\left(\rho \right)_{0} \left(RT\right)_{0}}\times p$ [By Eq. (i)]
$\Rightarrow \, \rho =\frac{3 \rho _{0}}{2}$