Tardigrade
Tardigrade - CET NEET JEE Exam App
Exams
Login
Signup
Tardigrade
Question
Physics
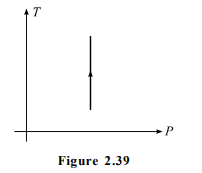
Pressure versus temperature graph of an ideal gas are as shown in figure-2.39. Choose the wrong statement
Question Error Report
Question is incomplete/wrong
Question not belongs to this Chapter
Answer is wrong
Solution is wrong
Answer & Solution is not matching
Spelling mistake
Image missing
Website not working properly
Other (not listed above)
Error description
Thank you for reporting, we will resolve it shortly
Back to Question
Thank you for reporting, we will resolve it shortly
Q. Pressure versus temperature graph of an ideal gas are as shown in figure-2.39. Choose the wrong statement
Kinetic Theory
A
Given process is isobaric
B
Density of gas is constant
C
Volume of gas is increasing
D
None of these
Solution:
As in the given process at constant pressure, temperature is increasing, gas volume is also increasing due to which gas density decreases