Q.
Match the following graphical variation with their
description.
A
B
i
a
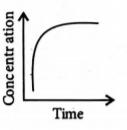
Variation in product concentration with time
ii
b
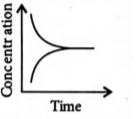
Reaction at equilibrium
iii
c
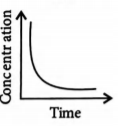
Variation in reactant concentration with time
| A | B | ||
|---|---|---|---|
| i | |
a | Variation in product concentration with time |
| ii | |
b | Reaction at equilibrium |
| iii | |
c | Variation in reactant concentration with time |
Equilibrium
Solution: