Q.
Many populations colonising a new habitat show a logistic population growth pattern over time, as shown in the figure below
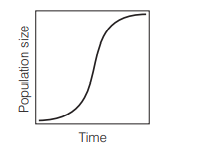
In such a population, the population growth rate
KVPYKVPY 2013
Solution:
The population growth pattern shown here is S-shaped (Sigmoidal curve). It is a population growth curve that shows an initial rapid growth (exponential growth) and then it slows down (decreases) as the carrying capacity is reached. Carrying capacity is the maximum number of individuals in a population that the environment can support.
