Q.
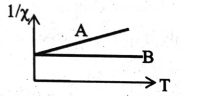
For two types of magnetic materials $A$ and $B$, variation of $\frac{1}{\chi}(\chi:$ susceptibility $)$ vs. temperature $T$ is shown in the figure. Then
WBJEEWBJEE 2021
Solution: