Thank you for reporting, we will resolve it shortly
Q.
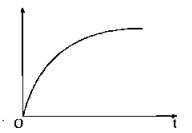
For the graph shown in figure which of the following
statements is/are possible ?
Nuclei
Solution:
The parameter represented by $y$-axis in the figure grows with time and becomes constant after a finite/long time interval. According to radioactive decay law the number of nuclei of a radioactive element left undecayed decreases exponentially with time so the total nuclei decayed can be represented like this curve hence option (B) is correct. If in a reactor a radionuclide is produced at a constant rate then these start decaying just after their production starts and after some time equilibrium comes when the decay rate becomes equal to the production rate then the number of such nuclei can also be represented by this curve, hence option (A) is correct.