Thank you for reporting, we will resolve it shortly
Q.
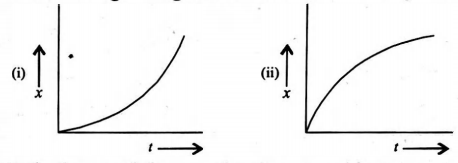
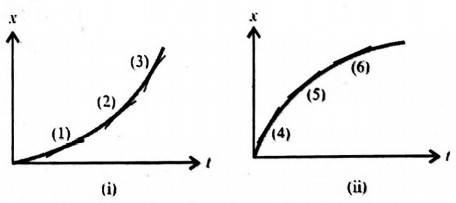
Figures show the displacement-time graphs of two particles moving along the x-axis. We can say that
Motion in a Straight Line
Solution:
In Fig. (i) the slopes at 1, 2, 3 go on increasing. It means velocity goes on increasing. So this depicts uniform acceleration. In Fig. (ii) the slopes at 4, 5, 6 go on decreasing. It means velocity goes on decreasing. So this depicts uniform retardation.