Question Error Report

Thank you for reporting, we will resolve it shortly

Back to Question

Q. Figure shows the graphical variation of displacement with time for the case of a particle moving along a straight line. The accelerations of the particle during the intervals $O A, A B$, $B C$ and $C D$ are respectively.Physics Question Image

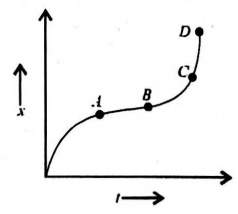
Motion in a Straight Line

Solution:

The slope of curve in x-t graph shows the velocity of the particle. As is evident, in portion OA slope goes on decreasing, hence velocity is decreasing or acceleration is negative.
In section AB, slope is constant. Hence velocity is constant or acceleration is 0. In the portion BC, the slope increases or velocity increases. So acceleration is positive.
In the section CD, slope is constant, velocity is constant, so acceleration is 0.