Q.
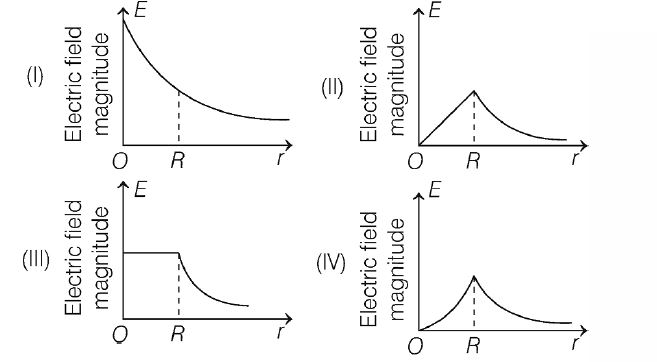
An isolated sphere of radius $R$ contains uniform volume distribution of positive charge. Which of the curve shown below, correctly illustrate s the dependence of the magnitude of the electric field of the sphere as a function of the distance $r$ from its centre?
KVPYKVPY 2011
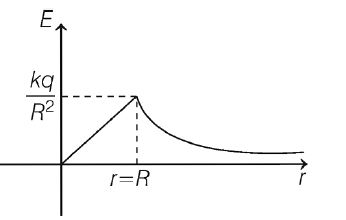
Solution: