Question Error Report

Thank you for reporting, we will resolve it shortly

Back to Question

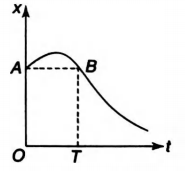
Q. Among the four graphs shown in the figure there is only one graph for which average velocity over the time interval $(0, T)$ can vanish for a suitably chosen $T$. Which one is it?

Motion in a Straight Line

Solution:

In graph (b) for one value of displacement there are two different points of time. Hence, for one time, the average velocity is positive and for other time is equivalent negative
image
As there are opposite velocities in the interval $0$ to $T$ hence average velocity can vanish in (b). This can be seen in the figure given below
Here, $OA = BT$ (same displacement) for two different points of time.