Question Error Report

Thank you for reporting, we will resolve it shortly

Back to Question

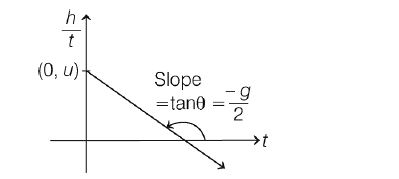
Q. A student performs an experiment to determine the acceleration due to gravity $g$. The student throws a steel ball up with initial velocity $u$ and measures the height $h$ travelled by it at different times $t$. The graph the student should plot on a graph paper to readily obtain the value of $g$ is

KVPYKVPY 2017Motion in a Straight Line

Solution:

For thrown ball
$h=ut- \frac{1}{2}gt^{2} $
$\Rightarrow \frac{h}{t} =u -\frac{1}{2}gt$
$\Rightarrow \frac{h}{t} =\frac{-g}{2} .t +u $
Comparing with $y = mx + c,$
graph of $\frac{h}{t} h$ versus $t$ is a straight line with slope $\frac{-g}{2} $
image
From above graph, value of acceleration due to gravity can be obtained by multiplying its slope with $2$.