Question Error Report

Thank you for reporting, we will resolve it shortly

Back to Question

Q. 
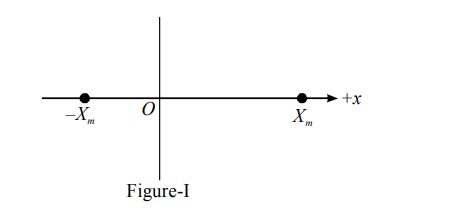
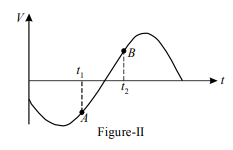
A particle is executing SHM between points $-X_{m}$ and $X_{m}$, as shown in figure-I. The velocity $V(t)$ of the particle is partially graphed and shown in figure-II. Two points $A$ and $B$ corresponding to time $t_{1}$ and time $t_{2}$ respectively are marked on the $V(t)$ curve:
image
image

Oscillations

Solution:

At time $t_{1}$, velocity of the particle is negative i.e. going towards $-X_{m}$.
From the graph, at time $t_{1}$, its speed is decreasing.
Therefore particle lies in between $-X_{m}$ and $0$ .
At time $t_{2}$, velocity is positive and its magnitude is less than maximum i.e, it has yet not crossed $O$.
It lies in between $-X_{m}$ and $0 .$
Phasc of particle at time $t_{1}$ is $\left(180+\theta_{1}\right)$
Phase of particle at time $t_{2}$ is $\left(270+\theta_{2}\right)$
Phase difference is $90+\left(\theta_{2}-\theta_{1}\right)$
$\theta_{2}-\theta_{1}$ can be negative making $\Delta f<90^{\circ}$ but can not be more than $90^{\circ}$.