Thank you for reporting, we will resolve it shortly
Q.
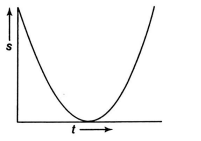
A ball is thrown vertically upwards. Which of the following plots represents the speed-time graph of the ball during its flight if the air resistance is not ignored?
Speed of body at highest point is zero.
From equation of motion, we have
$v^2=u^2-2 g h$
when $u=0, v^2=-2 g h$
As ball is thrown upwards velocity decreases as height decreases.
At the highest point velocity is zero after that body starts downward motion, its speed increases.