Tardigrade
Tardigrade - CET NEET JEE Exam App
Exams
Login
Signup
Tardigrade
Question
Biology
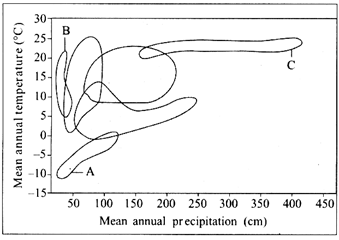
The graph given below is showing biome distribution with respect to annual temperature and precipitation. Identify A, B, and C, respectively. <img class=img-fluid question-image alt=Question src=https://cdn.tardigrade.in/q/nta/b-1xdpofqkrokp.png />
Q. The graph given below is showing biome distribution with respect to annual temperature and precipitation. Identify A, B, and C, respectively.
1606
235
NTA Abhyas
NTA Abhyas 2020
Organisms and Populations
Report Error
A
A-Desert; B-Arctic tundra; C-Coniferous forest
10%
B
A-Arctic tundra; B-Desert; C-Tropical forest
62%
C
A-Temperate forest; B-Arctic tundra; C-Desert
19%
D
A-Temperate forest; B-Arctic tundra; C-Grassland
10%
Solution: