- Tardigrade
- Question
- Physics
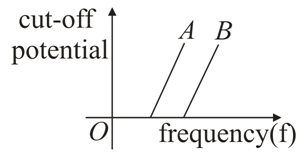
- Graph of cut-off potential (V0) versus frequency (.f.) for same intensity of light for metal plates A and B are as shown in the figure below. Choose the correct statement. <img class=img-fluid question-image alt=Question src=https://cdn.tardigrade.in/q/nta/p-hdtirhdormi3ce35.jpg />
Q.
Graph of cut-off potential versus frequency for same intensity of light for metal plates and are as shown in the figure below. Choose the correct statement.
Solution: