- Tardigrade
- Question
- Biology
- Following graph represents oxyhemoglobin dissociation curve . Point E and G represent venous O2 pressure during exercise and resting state respectively. How much total percentage of oxygen is unloaded in tissue during exercise? <img class=img-fluid question-image alt=image src=https://cdn.tardigrade.in/img/question/biology/61b6694c9c599cb11637119df6871f4c-.png />
Q.
Following graph represents oxyhemoglobin dissociation curve .
Point and represent venous pressure during exercise and resting state respectively. How much total percentage of oxygen is unloaded in tissue during exercise?
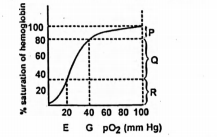
Solution: