Q.
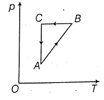
A cyclic process is shown in the p−T diagram. Which of the following curves shows the same process on the p−V diagram?
2588
228
NTA AbhyasNTA Abhyas 2020Thermodynamics
Report Error
Solution:
∵TpV= constant (for a given mass of an ideal gass)
AB: Isochoric process, V= constant T↑andp↑
BC: Isobaric process
P = constant T↓ hence V↓
CA: Isothermal process
p is decreasing hence, V is increasing, it means that p-V diagram will be rectangular hyperbola.